Rivers and streams never flow with the same intensity throughout the year. Rainfall, seasonal changes, snowmelt, and catchment conditions constantly influence the flow of water. To study these changing water levels scientifically, engineers use a hydrograph — a simple yet powerful tool to visualize how discharge varies with time. It is widely used in hydrology, hydroelectric power generation, and water resource planning.
A hydrograph helps answer crucial questions like:
• How much water is flowing right now?
• When will the stream reach its peak flow?
• How much water is available for power generation or irrigation?
In this article, we explore the meaning, components, uses, and applications of a hydrograph in an easy-to-understand manner, along with an example problem to strengthen your understanding.
What is a Hydrograph?
A hydrograph is a graphical representation that shows how the discharge (flow of water) in a river or channel varies with time. It is plotted with time on the horizontal axis (x-axis) and discharge or flow on the vertical axis (y-axis).
The discharge may be represented in different units such as:
- Gauge height (water level)
- Cubic meters per second per square kilometer (m³/s/km²)
- Power developed theoretically per meter of fall (kW/m)
- Energy output (kWh)
A hydrograph can be plotted for hours, days, weeks, or months, depending on the purpose of analysis.
In simple words, a hydrograph tells us how the flow of water changes with time.
Why is a Hydrograph Important?
Hydrographs provide valuable insights into the behavior of a river or stream. By studying a hydrograph, engineers and planners can understand the availability, variations, and pattern of water flow. This helps in:
- Water resource planning
- Flood prediction and control
- Hydroelectric power generation
- Irrigation scheduling
- Reservoir operations
A hydrograph is very similar to a Load Curve used in power systems. Just like a load curve shows how electrical load changes with time, a hydrograph shows how water discharge varies with time.
Related Topic:
The concept of hydrograph is closely related to the load curve, which shows variation of electrical demand with time.
🔗 “Load Curve in Power System”
Components of a Hydrograph
A typical hydrograph consists of three main components:
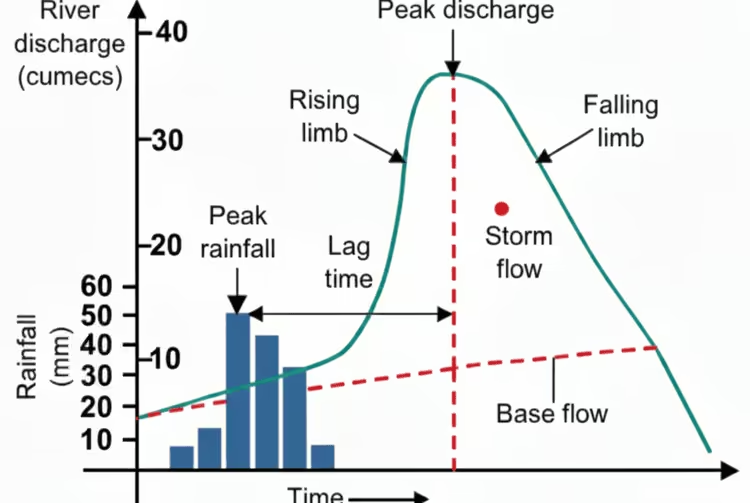
1. Rising Limb (or Ascending Limb)
This is the portion of the curve where discharge increases due to rainfall or snowmelt. It represents the response time of the catchment area and indicates how quickly water reaches the stream after precipitation.
2. Crest Segment (Peak Flow)
This is the highest point on the hydrograph which indicates the maximum discharge or peak runoff. It is crucial for flood forecasting and hydroelectric plant load planning.
3. Recession Limb (or Falling Limb)
It represents the decline in discharge after the peak. This portion shows how the catchment area gradually releases stored water back to the channel through groundwater, reservoirs, soil, and other natural storage.
What Information Can a Hydrograph Provide?
A hydrograph offers the following key information:
- Discharge at any point in time during the period studied
- Maximum and minimum runoff values
- Average runoff over the observation period
- Total volume of discharge up to a certain time, calculated by the area under the curve
This makes hydrographs extremely useful in analyzing the availability of streamflow for various applications.
Applications of Hydrograph
Hydrographs are used across several engineering domains:
Hydroelectric Power Generation
Hydrographs help determine the power available at different times of the day or year in a hydroelectric power plant.
Engineers use it to:
- Plan turbine operation
- Manage reservoir levels
- Optimize power generation
Related Topic:
Looking to learn more about how flowing water generates power?
Check this: Water Turbines – Pelton, Francis & Kaplan
Benefits of Using Hydrographs
Hydrographs offer several advantages in water resource engineering:
• Easy Visualization:
They provide a clear visual understanding of how streamflow changes with time.
• Helps in Flood Management:
Peak flow data helps predict floods and design flood-control systems such as dams, levees, and drainage networks.
• Useful for Irrigation Planning:
Farmers and irrigation authorities use hydrographs to decide the best time and volume for water release.
• Reservoir Operation & Water Storage Planning:
Hydrographs assist in deciding when to store water and when to release it.
• Hydropower Optimization:
Hydrographs help estimate the power potential of flowing water across seasons and ensure turbines run efficiently.
Limitations of Hydrographs
Despite their usefulness, hydrographs have some limitations:
- A single hydrograph does not always show the cause of discharge changes.
- Factors like infiltration, evaporation, and land use changes may not be visible directly.
- Requires accurate data collection over time.
- Not suitable for predicting long-term climate variations alone.
Hydrographs work best when used along with rainfall data, soil information, and watershed characteristics.
Types of Hydrographs
Hydrographs can be classified based on the type of data and purpose:
1. Simple Hydrograph
Represents runoff from a single rainfall event in a drainage basin.
2. Complex Hydrograph
Formed due to multiple storms occurring one after another over a short period.
3. Unit Hydrograph
Represents the runoff from 1 cm (or 1 mm) of effective rainfall over a catchment in a given duration (commonly 1 hour or 24 hours).
It is used for flood estimation, hydrologic modeling, and design of drainage structures.
Hydrograph vs Load Curve: A Quick Comparison
| Feature | Hydrograph | Load Curve |
|---|---|---|
| Shows variation of | Streamflow with time | Electrical load with time |
| Used in | Hydrology & Hydro power | Power system planning |
| Helps in | Water & flood management | Generation & distribution planning |
| Measured in | m³/s, kW/m, kWh | kW or MW |
(Insert internal link placeholder was already included in Part 1 as per IL-Hybrid rule)
Key Takeaways
✔ A hydrograph is a graph showing variation of discharge with time.
✔ It helps in flood control, hydropower generation, irrigation, and reservoir planning.
✔ Main components are Rising Limb, Peak/Crest, and Recession Limb.
✔ Area under the hydrograph gives the total volume of water discharged.
✔ Hydrographs are similar to load curves in electrical engineering.
✔ Widely used in water resource engineering, hydrology, and power generation.
Example Problem on Hydrograph (with Solution)
Problem:
A river recorded the following discharges over a 6-hour period after a rainfall event:
| Time (hours) | Discharge (m³/s) |
|---|---|
| 0 | 5 |
| 1 | 15 |
| 2 | 25 |
| 3 | 40 |
| 4 | 30 |
| 5 | 20 |
| 6 | 10 |
(a) Plot the hydrograph (conceptually).
(b) Calculate the total volume of water discharged in this 6-hour period.
Solution:
(a) Hydrograph:
- Rising limb: From 5 m³/s → 40 m³/s (from hour 0 to 3)
- Peak discharge: 40 m³/s at hour 3
- Recession limb: From 40 m³/s → 10 m³/s (from hour 3 to 6)
(b) Volume of Water Discharged:
Total discharge volume = Area under the hydrograph curve
(approximated using trapezoidal rule)
$$
V = \frac{1}{2}\, (h)\, (Q_1 + Q_2)
$$
Break into segments:
| Interval | Avg. Discharge (m³/s) | Time (hr) | Volume (m³) |
|---|---|---|---|
| 0–1 | (5+15)/2 = 10 | 1 | 10 × 3600 = 36,000 |
| 1–2 | (15+25)/2 = 20 | 1 | 20 × 3600 = 72,000 |
| 2–3 | (25+40)/2 = 32.5 | 1 | 32.5 × 3600 = 117,000 |
| 3–4 | (40+30)/2 = 35 | 1 | 35 × 3600 = 126,000 |
| 4–5 | (30+20)/2 = 25 | 1 | 25 × 3600 = 90,000 |
| 5–6 | (20+10)/2 = 15 | 1 | 15 × 3600 = 54,000 |
Total Volume = 36,000 + 72,000 + 117,000 + 126,000 + 90,000 + 54,000
Total Volume = 495,000 m³
Answer:
Total discharge over 6 hours = 495,000 cubic meters of water.
Conclusion
A hydrograph is an essential tool used in hydrology and power engineering to analyze how streamflow changes with time. It helps in water management, hydropower generation, flood control, and planning of reservoirs and irrigation networks.
Understanding hydrographs allows engineers and students to interpret water behavior scientifically and make informed decisions in water resource projects.