Load duration curves are used in power stations to illustrate the relationship between generating capacity requirements and capacity utilization. A load duration curve (LDC) is similar to a load curve but the demand data is ordered in descending order of magnitude, rather than chronologically.
Definition
When the load elements of a load curve are arranged in the order of descending magnitudes, the curve thus obtained is called a load duration curve.
Load Curve vs Load Duration Curve
A LDC is derived using the same data as a load curve, but the magnitude ordinates are sorted in descending order. As a result, the maximum load of a system is represented on the left, whereas decreasing loads of a system are represented on the right in descending order. In this sense, there is no difference between the area under the load duration curve and the area under the load curve.
Load Duration Curve from Load Curve
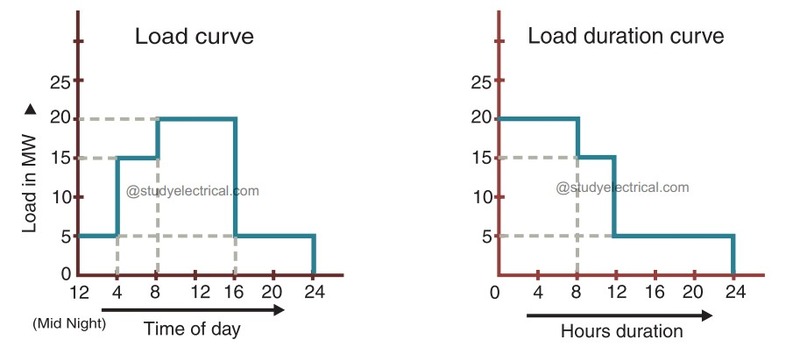
The daily load curve of a power station is shown in the figure below. You can easily obtain the daily LDC from it.
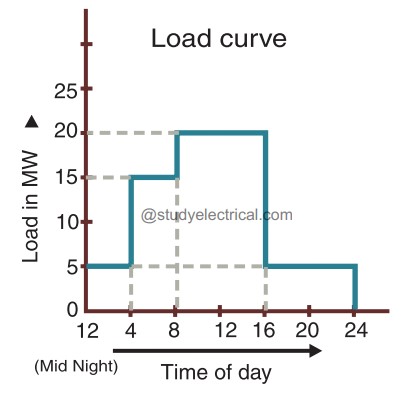
According to the daily load curve, the load elements are: 20 MW for 8 hours; 15 MW for 4 hours; and 5 MW for 12 hours.
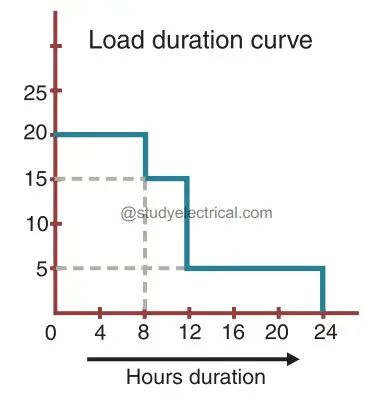
The daily load duration curve can be obtained by plotting these loads in descending order of magnitude. It is as shown below.
The load duration curve is the plot between load and time. The LDC is constructed using the daily load curve. The area under the LDC represents the total energy generated by the utility‘s generating system in the considered period.
An LDC is usually divided into the three parts.
- Baseload: The base load is the load below which the demand never falls and is supplied 100% of the time.
- Peaking load: It occurs for about 15% of the time
- Intermediate load: It represents the remaining load between the base load and the peaking load.
Important Points about LDC
The following points may be noted about load duration curves:
- The LDC presents the data in a more understandable way. This indicator readily displays the number of hours during which a given load has prevailed.
- The area under the LDC is equal to the area under the corresponding load curve. It is obvious that the area under a daily load duration curve (in kWh) will give the number of units generated that day.
- It is possible to extend the LDC to cover any period of time. One curve can portray the variation and distribution of demand for an entire year by dividing the abscissa from 0 to 8760 hours. The curve thus obtained is called the annual load duration curve.
How to Plot a Load Duration Curve
Now lets understand the calculation of LDC using an example.
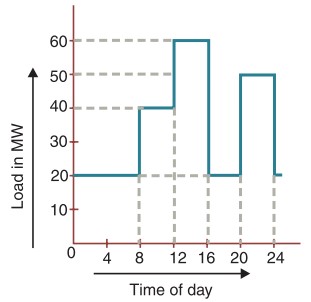
A power station has the following daily load cycle :
| Time in Hours | Load in MW |
|---|---|
| 6 – 8 | 20 |
| 8 – 12 | 40 |
| 12 – 16 | 60 |
| 16 – 20 | 20 |
| 20 – 24 | 50 |
| 24 – 6 | 20 |
Daily curve is drawn by taking the load along Y -axis and time along X-axis. For the
given load cycle, the load curve can be drawn as below.
From the load curve, you can draw the load duration curve as the figure shown below.
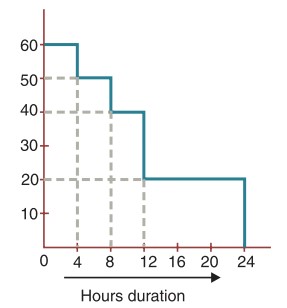
As we mentioned earlier, we can calculate the unit generated from the LDC.
Units generated/day = Area (in kWh) under daily load curve
= 103 [20 × 8 + 40 × 4 + 60 × 4 + 20 × 4 + 50 × 4]
= 840 × 103 kWh
Also,
Units generated/day = Area (in kWh) under daily LDC
= 103 [60 × 4 + 50 × 4 + 40 × 4 + 20 × 12]
= 840 × 103 kWh
Video
Frequently Asked Questions (FAQ)
-
Load duration curve is the plot between:
1. load and time
2. load and frequency
3. load and temperature
4. load and voltageAnswer: Option 1 : load and time
Detailed Explanation:
When the load elements of a load curve are arranged in the order of descending magnitudes, the curve thus obtained is called a load duration curve. The load duration curve is the plot between load and time. The load duration curve is constructed using the daily load curve. The area under the load duration curve represents the total energy supplied by the utility’s generating system during the year. -
What does a load duration curve represent?
a. The variation of load during different hours of the day.
b. Average load.
c. The number of hours for which a particular lasts during the day.
d. None of the above.Answer: c. The number of hours for which a particular lasts during the day.
-
What does the chronological load curve indicate?
a. Variation in demand factor during 24 hours.
b. Variation of demand from instant to instant during 24 hour.
c. The total energy consumed upto different times of the day.
d. The total number of hours for which a particular load lasts during the day.Answer: b. Variation of demand from instant to instant during 24 hour.