A load curve is a plot of the load demand (on the y-axis) versus the time (on the x-axis) in the chronological order.
It is a curve showing the variation of load on the power station with respect to time.

From out of the load connected, a consumer uses different fractions of the total load at various times of the day as per his/her requirements.
Since a power system has to supply load to all such consumers, the load to be supplied varies continuously with time and does not remain constant.
If the load is measured (in units of power) at regular intervals of time, say, once in an hour (or half-an-hour) and recorded, we can draw a curve known as the load curve.
When the data available in a load curve is ordered in descending order, it is called Load duration Curve.
Types of Load Curve
Load curve can be named in to three depending on the time period of data considered.
- Daily Load Curve
- Monthly Load Curve
- Annual Load Curve
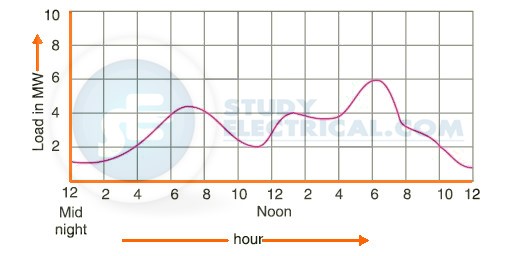
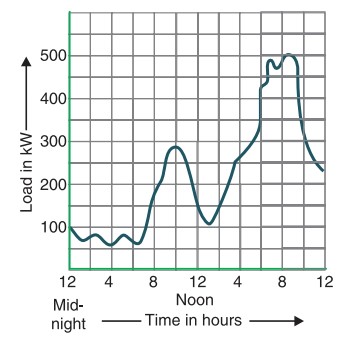
1. Daily Load Curve
A time period of only 24 hours is considered, and the resulting load curve, which is called a ‘Daily load curve‘, is shown in the figure.
2. Monthly Load Curve
The monthly load curve can be obtained from the daily load curves of that month.
For this purpose, average values of power over a month at different times of the day are calculated and then plotted on the graph.
The monthly load curve is generally used to fix the rates of energy.
3. Yearly/Annual Load Curve
The yearly load curve is obtained by considering the monthly load curves of that particular year.
The yearly load curve is generally used to determine the annual load factor.
However, to predict the annual requirements of energy, the occurrence of the load at different hours and days in a year and in the power supply economics, ‘Annual load curves’ are used.
An annual load curve is a plot of the load demand of the consumer against time in hours of the year (1 year: 8,760 hours).
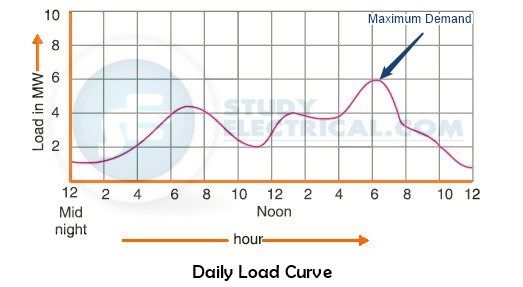
The significance of Load Curve
From the daily load curve shown above, the following information can be obtained.
- Observe the variation of load on the power system during different hours of the day.
- The area under this curve gives the number of units generated in a day.
- The highest point on that curve indicates the maximum demand on the power station on that day.
- The area of this curve divided by 24 hours gives the average load on the power station in the day.
- Load duration curve can be derived from the data available from a load curve.
- It helps in the selection of the rating and number of generating units required.
The daily load curves have gained great importance in the generation industry due to the fact that they supply the following information.
- On the daily load curve, you can see how the load on the power station varies during each hour of the day.
- The area under the daily load curve gives the number of units generated on that day.
- Units generated/day = Area (in kWh) under daily load curve.
- The peak on the daily load curve indicates the maximum demand on the station on that day.
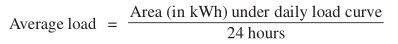
- By dividing the area under the daily load curve by the total number of hours, the daily average load is obtained.
- Average load = Area (in kWh) under daily load curve / 24 hours
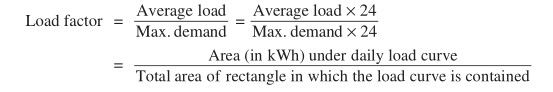
- Load factor is calculated from daily load curve by taking the ratio between the area under the load curve and the area of the rectangle within which the load curve is contained.
- Load Factor = Average Load / Maximum demand (peak demand)
- The load curve is used to select the size and number of generating units. It is chosen based on the load curve which determines how many and what size of generating units are needed. In this way, the generating units are operated at or near their maximum efficiency.
- When preparing the operating schedule for the power station, load curves are helpful. A plant’s operating schedule is the timing and sequence in which various generating units (such as alternators) will be put into operation.
Load Curves and Selection of Generating Units
The load on a power station is not constant; it varies from time to time. Obviously, a single generating unit (i.e., alternator) will not be an economical solution to meet this varying load. The reason for this is that one unit will have a very low efficiency during periods of light loads at the power station. Therefore, a power station usually contains a variety of generating units with different capacities.
The size and number of the generating units are chosen according to the station’s annual load curve. It is imperative to select the number and size of the units so that they fit correctly with the station load curve. When this underlying principle is adhered to, it is possible to operate the generating units at or near their maximum efficiency.
How Generating Units are Selected?
The principle of selection of number and sizes of generating units with the help of load curve is illustrated here. The annual load curve of a station is shown in the figure below.
It is clear from the curve that the load on the station has wide variations. The minimum load being around 50 kW and the maximum load approaching 500 kW. The use of a single unit to meet such a varying load will be highly uneconomical.
The total plant capacity is divided into several generating units of varying sizes according to the load curve. This is illustrated in the figure below where the plant capacity is divided into three units numbered 1, 2 and 3.
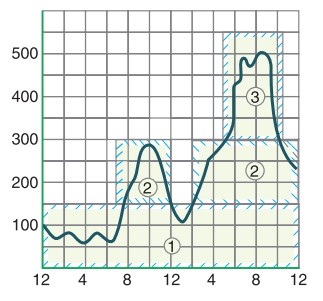
Colored cyan is the capacity of the unit as it is being used. The three units employed have different capacities and are used according to the station’s demand.
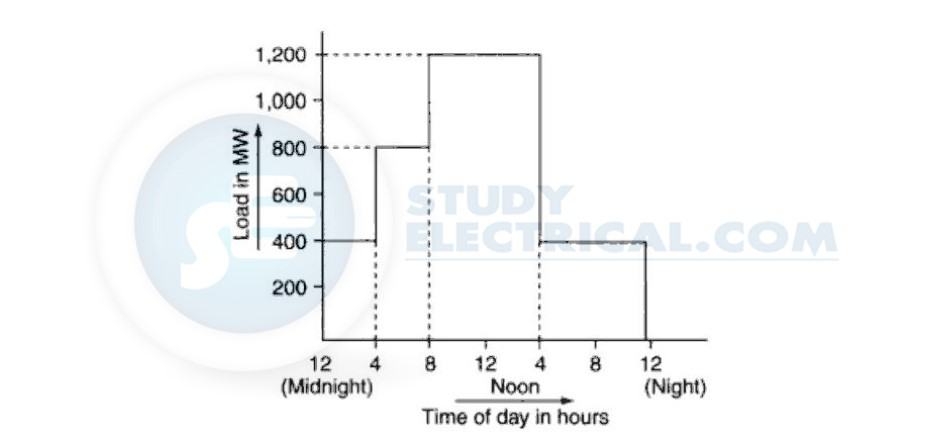
In this case, the operating schedule can be as follows:
| Time | Units in Operation |
|---|---|
| From 12 midnight to 7 A.M. | Only unit no.1 is put in operation. |
| From 7 A.M. to 12.00 noon | Unit no. 2 is also started so that both units 1 and 2 are in operation. |
| From 12.00 noon to 2 P.M. | Unit no. 2 is stopped and only unit 1operates. |
| From 2 P.M. to 5 P.M. | Unit no. 2 is again started. Now units 1 and 2 are in operation. |
| From 5 P.M. to 10.30 P.M. | Units 1, 2 and 3 are put in operation. |
| From 10. 30 P.M. to 12.00 midnight | Units 1 and 2 are put in operation. |
Thus, if the number and size of generating units are selected properly, they will run near their maximum efficiency. Consequently, the cost of producing electrical energy is reduced overall.


Give me the required answers
hello. Please explain about source of the Diagram of load curve.
I want use for my paper.